


Our Facility
Welcome to our cutting-edge Systems Pharmacology Facility, where innovation meets healthcare. We specialize in harnessing the power of omic technology to revolutionize drug discovery and development. Our interdisciplinary team of experts combines genomics, proteomics, and other advanced omic approaches to unravel the intricate interactions between drugs, biological systems, and diseases. With state-of-the-art equipment and a data-driven approach, we accelerate the identification of novel drug targets, personalized treatment strategies, and safer medications. Step into the future of pharmaceutical research with us, where omic technology paves the way for more effective, precise, and tailored therapeutic solutions.
-
Our lab is specialized in high-throughput imaging. Equipped with cutting-edge high-content imaging platforms, and automated inverted microscopy, we are well set up to perform both large-scale drug screening as well as long-term time-lapse studies.
Nikon Ti2-E | Operetta CLS | Operetta
-
Our laboratory's state-of-the-art automation technology accelerates drug discovery by enabling rapid screening, precision in compound handling, and robust data analysis, streamlining the journey from research to therapeutic solutions
-
CyteFinder II HT | PhenoCycler-Fusion | PhenoImager
-
-
Enabling research with unparalleled computational power. Our service ensure that all data-intensive research is well taken care of.
Nikon Ti2-E


Our facility's microscope, the NIKON Ti2-E, PFS, is an advanced electrically-driven inverted microscope equipped with an automatic tracking system, ensuring precise and efficient research processes with imaging modalities, for example, DIC (Differential Interference Contrast), apodized and external phase contrast, NAMC (Nikon Advanced Modulation Contrast), auto-correction collar, widefield fluorescence and Live cell imaging (long term).
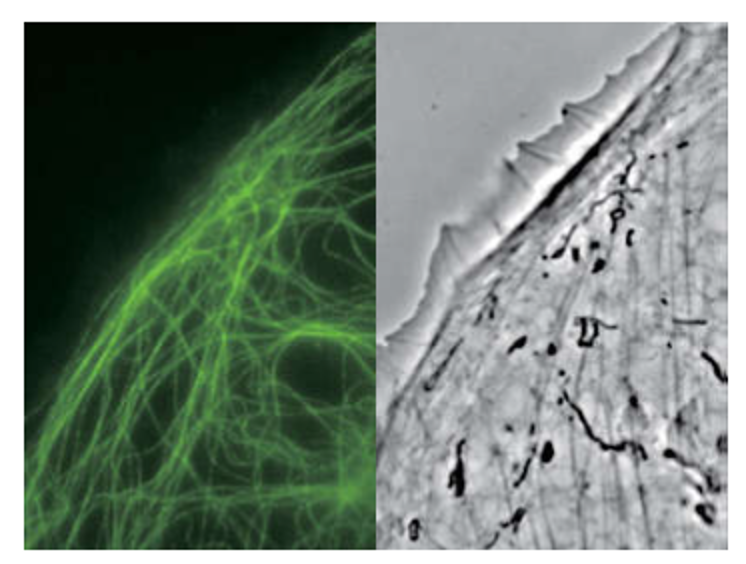
Epi-fluorescence and external phase contrast images: PTK-1 cells labeled with GFP-alpha-tubulin captured with CFI Apochromat TIRF 100XC Oil objective.
Photo courtesy of Alexey Khodjakov, Ph.D. Research Scientist VI / Professor, Wadsworth Center

Large image stitch of an entire 96-well plate containing GFP and RFP neurons using a Plan Apochromat Lambda 4X objective.
Sample courtesy of Jeanette Osterloh, Ph.D. and Steve Finkbeiner, M.D., Ph.D., Gladstone Institutes, UCSF.

NAMC image: Mouse embryos, captured with CFI S Plan Fluor ELWD NAMC 20XC objective.

BSC-1 cells captured with CFI S Plan Fluor ELWD ADM 40XC objective.
Volume Contrast
Volume contrast (VC) technique utilizes a series of label-free, brightfield images captured at various Z-depths to assemble a phase distribution image. Volume contrast renders cells easily identifiable as objects for automated counting and area analysis. As this method utilizes brightfield imaging, volume contrast enables in-line, non-destructive analysis of cells, suitable for a wide variety of applications. Note: For Ti2-E only.
Accurate identification of cells from label-free cultures for automated cell counting and area measurements.

Brightfeild
Volume contrast
HeLa cells imaged with CFI S Plan Fluor ELWD 20XC.

Cell identification using VC images
Cells encircled in red are correctly identified as three separate objects, resulting in accurate cell counts.
Perfect Focus System
In order to improve the focusing stability, both Z-drive and Perfect Focus System (PFS) autofocusing mechanisms have been completely redesigned. PFS automatically corrects focus drift caused by temperature changes and mechanical vibrations, which can be caused by a variety of factors including the addition of reagents to the sample and multi-position imaging.


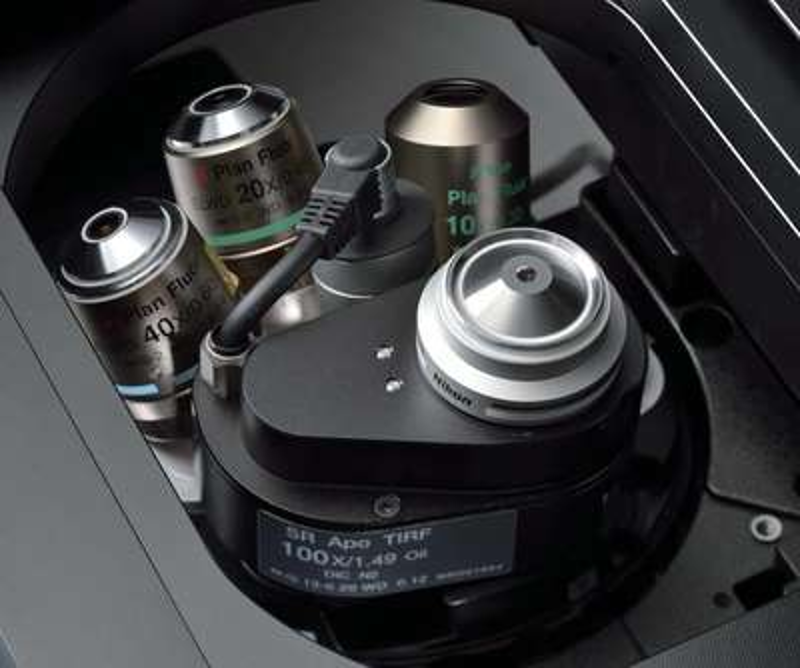
Our microscope features a collection of 6 distinct lenses including:
CFI Plan Fluor DL 4X N.A.0.13
CFI Plan Fluor DL 10X N.A.0.3
CFI Plan Fluor ELWD ADM 20x NA 0.45
CFI Plan Apo 20x N.A.0.75
CFI Plan Apo 40x N.A.0.95
CFI Plan Apo 60WI with N.A. 1.2
The illumination is provided by the Lumencor Spectra X, which offers ideal fluorescence imaging conditions. It also includes 8 specialized color filters:

*Orange and Cherry2 filter has to insert into Green/Yellow channel in Spectra controller
The microscope is further equipped with a motorized filter box that can accommodate 6 filters and is coupled with a high-speed sCMOS camera, the Andor Zyla 4.2 PLUS 10-TAP. To enable precise environmental control, it is complemented by Okolab stage top incubator and cage incubator accessories and NIS Element image acquisition software.
This comprehensive setup positions our lab at the forefront of precision imaging, facilitating innovative research in the field of precision medicine and cancer research.
Operetta CLS
Operetta CLS is an improved high content imager that is equipped with automated water-immersion objectives that can capture up to four times more light than high numerical aperture air objectives can. Not only an exceptional image data quality, but users can also benefit in two ways. Dedicated live-cell samples can be excited with less light to protect them from photodamage or you can significantly increase the throughput of applications such as 3D stack acquisition. SiSP’s operetta CLS system is integrated with the plate::handler system, with three 14-position plate shelves for automated plate loading, and is therefore suitable for high-throughput screening workflow. The Operetta CLS is also equipped with an environmental control unit for temperature (37-42 C°) and CO2 control (1-10%) enabling live cell imaging applications.

8 Excitation wavelengths (365, 405, 440, 475, 510, 550, 630, 660 nm)

Emillion Filters
Emission Filter (430-500): Specifically designed for applications utilizing Hoechst 33342, Hoechst 33258, DAPI, and HCS CellMask™ Blue, allowing precise visualization and analysis of these fluorophores.
Emission Filter (460-515): Tailored for working with Cerulean/CFP or CFP/YFP ratiometric FRET applications, offering enhanced flexibility in fluorescence resonance energy transfer studies.
Emission Filter (500-550): Suited for imaging with a variety of markers including Alexa Fluor® 488, EGFP, MitoTracker® Green, Fluo-4, FITC, Yo-PRO®-1, Sapphire, and Qdot® 525, supporting a wide array of fluorescence imaging applications.
Emission Filter (515-580): Optimized for YFP, making it an essential tool for ratiometric CFP/YFP FRET experiments.
Emission Filter (570-620): Crafted for imaging dyes such as DsRed, Alexa Fluor® 546, 5-TAMRA, Cy™3, MitoTracker® Orange, mOrange, mCherry, BOBO-3, Rhodamine Phalloidine, and Qdot®585, allowing precise differentiation and detection.
Emission Filter (570-650): Ideal for the precise observation of Alexa Fluor® 568, Propidium Iodide, mCherry, Alexa Fluor® 594, mKate, dTomato, and TagRFP, enabling comprehensive cellular and molecular imaging.
Emission Filter (655-705): Designed for applications involving Alexa Fluor® 633, Alexa Fluor® 647, VivoTag 645, Cy™5, CellMask™ DeepRed, and MitoTracker® Deep Red, providing the required specificity and accuracy.
Emission Filter (685-760): Customized for the detection of DRAQ5™, Qdot® 705, and other transmission mode applications, completing the array of versatile, high-precision emission filters that enable our lab's advanced fluorescence imaging capabilities.

|
Objective lenses |
NA |
Free working distance(mm) |
Correction collar |
Corrected for a plate thickness of (mm) |
|
1.25x Air |
0.03 |
4 |
No |
0.17 |
|
5x Air |
0.16 |
12.1* |
No |
0.17 |
|
10x Air |
0.3 |
5.2 |
No |
0.17 |
|
20x Air |
0.4 |
8.28* |
Yes |
0 - 1.5 |
|
20x Water |
1.0 |
1.7 |
No |
0.17 |
|
40x Water |
1.1 |
0.62 |
No |
0.17 |
|
63x Water |
1.15 |
0.6 |
No |
0.17 |
*The working distance of these objectives is so large that it will not be completely used due to the given limitation of the z-drive.
Intelligent acquisition (PreciScan feature) allows users to scan objects at low magnification and automatically rescan only the desired object at higher magnification.

The platform can easily visualize 3D models by a 3D- and an XYZ-viewer and is able to quantify volumetric and other 3D-related phenotypic readouts.


Lab Automation
Our laboratory has integrated state-of-the-art automation technology to streamline the drug discovery process. Utilizing advanced robotic systems and intelligent software, our automated workflows enable rapid screening, precision in compound handling, and robust data analysis, accelerating the journey from initial research to novel therapeutic solutions
RARECYTE CyteFinder II HT Instrument
High-speed whole slide imaging in seven fluorescence channels and brightfield, capabilities for IF, IHC, and H&E samples. With the capacity to scan up to 80 slides and barcode-driven workflow for sample tracking, this platform is designed to empower clinical researchers engaged in comprehensive cellular and tissue-based multiplexed analysis.


Automatic focusing system
It is not necessary to adjust the manual focus. CyteFinder II HT allows you to adjust automatically via the image-based autofocus system.
Magnification
Depending on the area or magnification you need, CyteFinder II HT is composed of a variety of objective lenses, including: 4X (0.2 NA), 10X (0.3 NA), 20X (0.75 NA), and 40X (0.60 NA, 0.95 NA).


4X

10X

20X

40X
Emission wavelength
There are 6 emission wavelengths
Emission filter wavelength > 420 nm
Emission filter wavelength > 510 nm
Emission filter wavelength > 570 nm
Emission filter wavelength > 620 nm
Emission filter wavelength > 670 nm
Emission filter wavelength > 760 nm
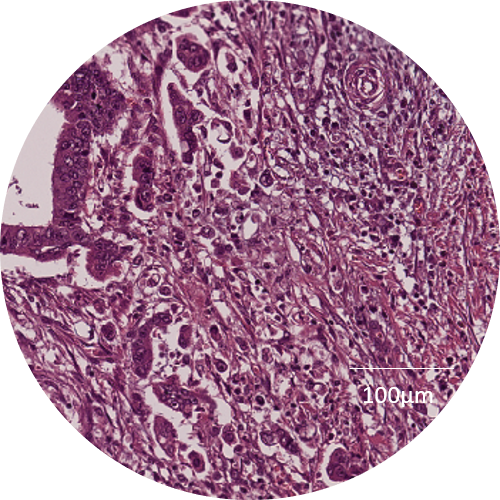
H&E

IF
Scan areas
The area of the slide that can be scanned varies depending on the objective you are using. Due to the objective size and numerical aperture (NA), larger magnification objectives cannot scan the entire surface area of the slide. For more information, see the figure below. All scan areas are 1.0 mm from the slide edges unless otherwise noted.

Compatible slides and coverslips
The CyteFinder II HT uses an automated loading and scanning mechanism that is compatible with certain slide and coverslip specifications. RareCyte recommended the use of slides and coverslips in Table 1, which have been verified for use in the CyteFinder II HT system.
If you choose to use other products, they must conform to the specifications in Table 2.
Use of materials that do not meet specifications may result in compromised scan results, may damage the slide samples, or may damage the instrument.

Table 1: Recommended Slide and Coverslips

Table 2: Slide and Coverslip Specifications
PhenoCycler™-Fusion System

The PhenoCycler™-Fusion is the fastest spatial biology solution that enables ultrahigh-flex spatial phenotyping of whole slides at single-cell resolution by integrating automated fluidics and iterative imaging.
In a PhenoCycler-Fusion experiment, a tissue section on a slide is stained manually using a panel of PhenoCycler Antibodies simultaneously. After staining is complete, the slide is placed into the flow cell slide carrier which then is placed into the fusion stage, and a PhenoCycler-Fusion run is performed on the stained tissue section using the PhenoCycler-Fusion system.
The PhenoCycler run is fully automated and executed by the controller software. PhenoCycler Reporters are dispensed onto the tissue by the PhenoCycler Instrument and revealed via fluorescence microscopy using the PhenoCycler-Fusion. The runs are comprised of multiple cycles: in each cycle, the reporters reveal up to 3 markers of interest and DAPI simultaneously, the tissue is imaged in each spectrally distinct fluorescence channel, and then the reporters are removed from the tissue by a gentle isothermal wash. The repetition of these cycles using different reporters allows for the visualization of a full PhenoCycler antibody panel in a single experiment and on the same tissue area.
The PhenoCycler workflow uses a proprietary chemistry that preserves both tissue morphology and antibody staining throughout the experiment. Users can purchase PhenoCycler inventoried antibodies or customize their panel by conjugating purified antibodies to PhenoCycler Barcodes.
Main features summary:
Automated cycling and imaging (3 markers/cycle) of 100+ biomarkers across the whole slides
Removal of autofluorescence
Photobleaching by using an electronically gated excitation source synchronized with its camera.
Analysis software includes protein expression and spatial phenotyping
General specification
Filters
Filter set options are:
DAPI-ATTO550-CY5-AF750 for FFPE tissue section
DAPI-ATTO550-CY5-AF448 for FF tissue section
Pixel Resolution
Under slide scan resolution, the following resolution can be selected:
1.0 µm per pixel (10x)
0.5 µm per pixel (20x)
0.25 µm per pixel (40x)

The PhenoCycler Workflow:
Reveal: Up to 3 PhenoCycler Reporters are dispensed onto the antibody-stained tissue slide by the PhenoCycler Instrument and allowed to incubate. PhenoCycler Reporters hybridize to complementary barcodes conjugated to target antibodies.
Image: The tissue is scanned by the PhenoImager Fusion microscope which is integrated into the PhenoCycler Instrument.
Remove: A gentle isothermal wash is performed to remove the Reporters.


During a PhenoCycler-Fusion multicycle experiment, acquired images are processed in parallel and are at the end of the run, available as whole slide scans in QPTIFF format, which contains all image layers and metadata. Whole-slide image files written from PhenoCycler-Fusion are viewable in Phenochart software. Cell segmentation can then be performed using the inForm software. The results can be exported and used in other external software platforms.
Tissue preparation guidelines
The fresh-frozen (FF) tissue sections adhered directly onto slides can be stored at -80C for up to 6 months before staining.
For both FF and formalin-fixed paraffin-embedded (FFPE) tissue sections, the tissue thickness must not exceed 10 µm as this can affect the autofocusing capabilities of the microscope and the tissue sections should be completely adhered to the slide without folds or tears.
The tissue slides should not be stacked on top of one another to avoid damage.
The tissue section must be placed on the positive-charged slide (recommended: Leica Apex Adhesive Slide size 1”x 3”x0.04” (Cat. #3800080) or Fisherbrand Superfrost Plus Microscope Slides (Cat. #12-550-15)) following the below figure.

Guideline for assigning PhenoCycler Barcodes to Antibodies in the custom-conjugated antibodies/marker of interest
Identify and validate unconjugated antibody clones in your tissue of interest: Refer to Akoya’s Screened Antibody List for clones that have been successfully conjugated and shown positive staining patterns in relevant tissue samples.
Assess quantities of reagents.
Purchase PhenoCycler Barcodes and PhenoCycler Reporters.
Consider antigen abundance and fluorescence channel sensitivity when selecting barcodes for conjugation. Please follow the below images for guidance.


Inkjet Microarray Application
Arrayjet instruments and services provide high-quality microarrays of cell and tissue lysates, serum, CSF, and other liquid biopsies. Samples can be crude extracts for maximum throughput or pre-fractionated for greater resolution.

Supporting biomarker discovery
Reverse Phase Protein Array (RPPA)
RPPA immobilizes numerous lysed samples on nitrocellulose for efficient biomarker screening and quantification,
enabling high-throughput analysis.
Perfect for:
Liquid biopsy biomarker analysis researchers
Biomarker researchers seeking high-throughput Western blot and mass spectrometry alternatives.

Main features:
Increase research throughput
Unique microarray platform delivers consistent, reproducible, high-density microarrays with excellent spot morphology and consistency.
Advanced sample loading
A sample is loaded into the base of the printhead using a JetSpyder™ which detaches from the printhead before printing. The JetSpyder™ is designed to reach the bottom of sample wells and minimize waste, whilst eliminating cross-contamination.
12 samples can be loaded simultaneously
Aspirate as little as 0.5 µl – enough to print 2000 spots
Accurate spot sizes of 40 pL – 10 nL (50 µm – 1 mm)


InnoScan 710-IR-AL
Using validated antibodies, biomarkers of cell faith can be followed in a single experiment. Nitrocellulose slides are most often the substrate of choice for RPPA because of their high protein binding capacity, detection sensitivity, and dynamic range are two highly critical points to achieving reliable results.
2-Color near infrared microarray scanner


Main features:
Increased sensitivity
NIR excitation lasers to avoid support background
Simultaneous confocal PMT detection
All nitrocellulose slide formats


Real-time autofocus
Optimized for nitrocellulose or PVDF substrates
Perfect homogeneity across the entire reading surface
Automated image acquisition with MAPIX software
Adjustable reading speed
From 10 to 35 lines per second
Test results were obtained very quickly 3.6 minutes to read an entire slide with 10μm/pixel
670 nm and 785 nm excitation
3 μm/pixel resolution
Mapix - Microarray image acquisition and analysis software


Mapix Update
Upgrades are continuously available on the internet
Gridding
Automatique searches for grids, blocks, and spots: circular, square, and rectangular shapes
Automatic segmentation of spots
Gal file importation and creation
Local or global background noise measurement
Plug-in
Integrate specific user applications
Quantification
Results in tabbed text format (TXT) and GPR
Quality control with spot marking
Normalization algorithms

Software update

Gridding

Plug-in

Quantification